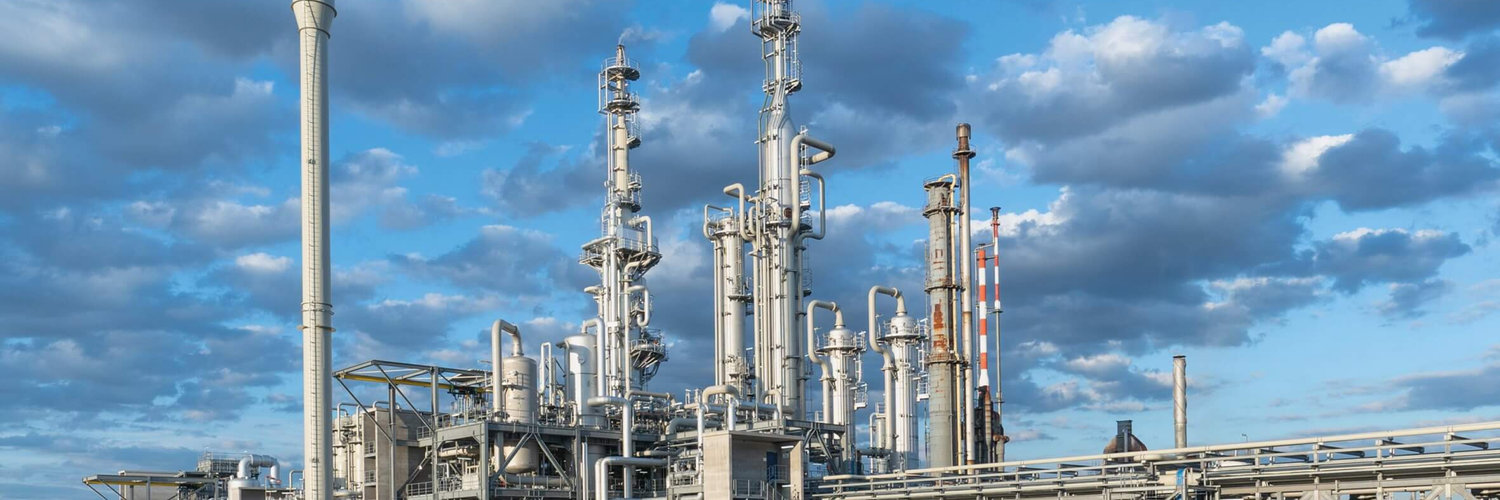

Worley Ltd
F:WF9

Decide at what price you'd be comfortable buying and we'll help you stay ready.
|
W
|
Worley Ltd
F:WF9
|
AU |
|
C
|
Chocoladefabriken Lindt & Spruengli AG
DUS:LSPP
|
CH |
|
R
|
Rojana Industrial Park PCL
SET:ROJNA
|
TH |
|
B
|
BAE Systems PLC
XMUN:BSP
|
UK |
|
D
|
Deutsche Post AG
XMUN:DPWA
|
DE |
|
G
|
Gilead Sciences Inc
XMUN:GIS
|
US |
|
N
|
Nuvo Pharmaceuticals Inc
F:23N
|
CA |
|
G
|
Geron Corp
F:GON
|
US |

|
Imperial Brands PLC
LSE:IMB
|
UK |
|
A
|
Air Water Inc
F:0AW
|
JP |
|
Q
|
Quanta Services Inc
F:QAA
|
US |
|
H
|
Helen of Troy Ltd
F:HT2
|
BM |

|
Newmark Group Inc
NASDAQ:NMRK
|
US |

|
Spire Global Inc
NYSE:SPIR
|
US |

|
Ares Capital Corp
NASDAQ:ARCC
|
US |

|
Plug Power Inc
NASDAQ:PLUG
|
US |
|
D
|
D R Horton Inc
F:HO2
|
US |
|
Gurit Holding AG
F:GVM0
|
CH |
|
Aptitude Software Group PLC
F:MH5B
|
UK |

|
MERLIN Properties SOCIMI SA
F:MEQA
|
ES |
|
R
|
Ratchthani Leasing PCL
SET:THANI
|
TH |
Dividends
Dividend Yield
Worley Ltd

| Current Yield | |
| Min Yield | |
| Max Yield | |
| Average Yield | |
| Median Yield |
Dividend Per Share
Worley Ltd
WF9 have increased by 61%.
Payout Ratio
Worley Ltd
Peers Comparison
Dividends
Shareholder Yield
Current shareholder yield for WF9 is
hidden
.
Peers Comparison
Shareholder Yield
Buybacks
Buyback Yield measures how much a company reduces its outstanding shares through repurchases, expressed as a percentage.
This metric directly reflects the company’s efforts to return value to shareholders. By reducing the number of shares, buybacks can increase earnings per share and potentially boost the stock's price.

Peers Comparison
Buybacks
Debt Paydown
Debt Paydown Yield measures the amount of debt a company repays within a specific period, shown as a percentage of its market capitalization.
This metric indicates how the company is using its capital to decrease financial liabilities, which can strengthen its financial health and potentially enhance shareholder value.
Peers Comparison
Debt Paydown
Price Appreciation
WF9 Price
Worley Ltd
| Average Annual Return |
N/A
|
| Standard Deviation of Annual Returns |
N/A
|
| Max Drawdown | -26% |
| Market Capitalization | 5.5B EUR |
| Shares Outstanding | 907 639 061 |
| Percentage of Shares Shorted |
N/A
|
