OrganiGram Holdings Inc
TSX:OGI

Decide at what price you'd be comfortable buying and we'll help you stay ready.

|
Johnson & Johnson
NYSE:JNJ
|
US |

|
Berkshire Hathaway Inc
NYSE:BRK.A
|
US |

|
Bank of America Corp
NYSE:BAC
|
US |

|
Mastercard Inc
NYSE:MA
|
US |

|
UnitedHealth Group Inc
NYSE:UNH
|
US |

|
Exxon Mobil Corp
NYSE:XOM
|
US |

|
Pfizer Inc
NYSE:PFE
|
US |

|
Nike Inc
NYSE:NKE
|
US |

|
Visa Inc
NYSE:V
|
US |

|
Alibaba Group Holding Ltd
NYSE:BABA
|
CN |

|
JPMorgan Chase & Co
NYSE:JPM
|
US |

|
Coca-Cola Co
NYSE:KO
|
US |

|
Verizon Communications Inc
NYSE:VZ
|
US |

|
Chevron Corp
NYSE:CVX
|
US |

|
Walt Disney Co
NYSE:DIS
|
US |

|
PayPal Holdings Inc
NASDAQ:PYPL
|
US |
P/B
Price to Book (P/B) ratio compares a company`s market value to its book value. It shows how much investors are paying for each dollar of net assets on the balance sheet.
Price to Book (P/B) ratio compares a company`s market value to its book value. It shows how much investors are paying for each dollar of net assets on the balance sheet.
Valuation Scenarios
If P/B returns to its 3-Year Average (0.7), the stock would be worth CA$2.02 (4% upside from current price).
| Scenario | P/B Value | Implied Price | Upside/Downside |
|---|---|---|---|
| Current Multiple | 0.7 | CA$1.95 |
0%
|
| 3-Year Average | 0.7 | CA$2.02 |
+4%
|
| 5-Year Average | 0.8 | CA$2.31 |
+18%
|
| Industry Average | 1.3 | CA$3.68 |
+89%
|
| Country Average | 2.7 | CA$7.27 |
+273%
|
Forward P/B
Today’s price vs future total equity
Peer Comparison
| Market Cap | P/B | P/E | ||||
|---|---|---|---|---|---|---|
| CA |

|
OrganiGram Holdings Inc
TSX:OGI
|
263.5m CAD | 0.7 | 14.5 | |
| US |

|
Eli Lilly and Co
NYSE:LLY
|
835.2B USD | 31.5 | 40.5 | |
| US |
|
Johnson & Johnson
NYSE:JNJ
|
547.8B USD | 6.7 | 26 | |
| CH |

|
Roche Holding AG
SIX:ROG
|
248.4B CHF | 7.7 | 20.1 | |
| UK |

|
AstraZeneca PLC
LSE:AZN
|
216.4B GBP | 5.9 | 28 | |
| CH |

|
Novartis AG
SIX:NOVN
|
223.1B CHF | 5.9 | 19.5 | |
| US |

|
Merck & Co Inc
NYSE:MRK
|
276.9B USD | 5.3 | 15.2 | |
| IE |
E
|
Endo International PLC
LSE:0Y5F
|
244.4B USD | -58.7 | -83.6 | |
| DK |

|
Novo Nordisk A/S
CSE:NOVO B
|
1.1T DKK | 6 | 11.4 | |
| US |
|
Pfizer Inc
NYSE:PFE
|
153.5B USD | 1.8 | 19.8 | |
| US |

|
Bristol-Myers Squibb Co
NYSE:BMY
|
118.2B USD | 6.4 | 16.8 |
Market Distribution
| Min | 0 |
| 30th Percentile | 1.6 |
| Median | 2.7 |
| 70th Percentile | 4.9 |
| Max | 1 402.4 |
Other Multiples
OrganiGram Holdings Inc
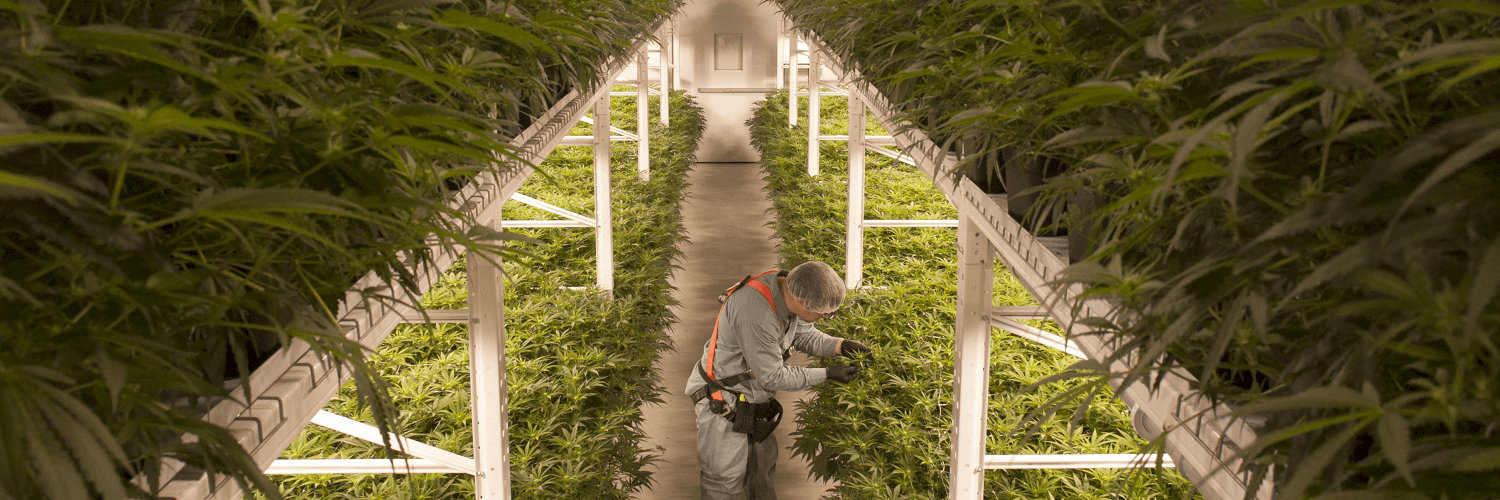
Glance View
OrganiGram Holdings, Inc. engages in the production and sale of medical marijuana. The company is headquartered in Moncton, New Brunswick. The company went IPO on 2011-11-24. Organigram is a licensed producer of cannabis and extract-based products. The firm is focused on producing, indoor-grown cannabis for patients and adult recreational consumers in Canada. Organigram is permitted to possess, produce, sell, provide, ship, deliver and transport cannabis, cannabis plants and cannabis oil. The company is also authorized for wholesale shipping of cannabis plant cuttings, dried flower, blends, pre-rolls and cannabis oil to approved retailers and wholesalers for adult-use recreational cannabis under individual provincial and territorial regulations as per Cannabis Act. Organigram distributes its products mainly through the Company’s online store or by phone. Organigram has also developed a portfolio of legal adult use recreational cannabis brands, including The Edison Cannabis Company, SHRED, ANKR Organics, Indi, Bag o’ Buds and Trailblazer.
