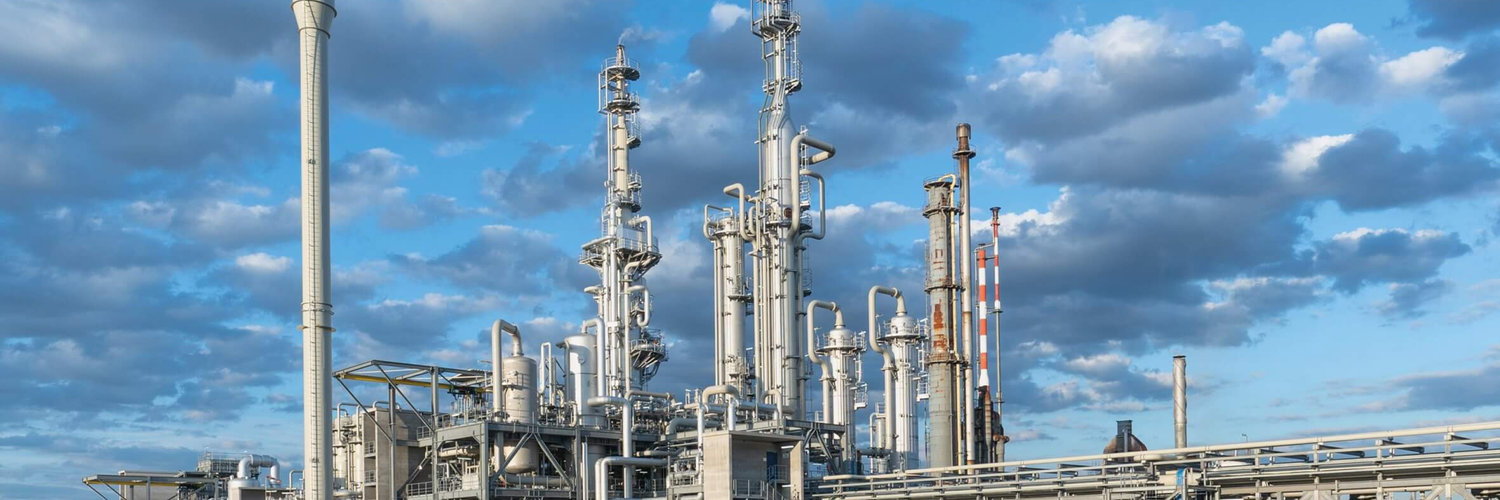

LyondellBasell Industries NV
NYSE:LYB

Decide at what price you'd be comfortable buying and we'll help you stay ready.

|
LyondellBasell Industries NV
NYSE:LYB
|
UK |

|
GrowGeneration Corp
NASDAQ:GRWG
|
US |
|
S
|
Sansei Landic Co Ltd
TSE:3277
|
JP |

|
Toast Inc
NYSE:TOST
|
US |
|
S
|
Super Group Ltd
JSE:SPG
|
ZA |
|
C
|
Commerzbank AG
F:ZZMS
|
DE |
|
A
|
Aviakompaniya UTair PAO
MOEX:UTAR
|
RU |
Profitability Summary
LyondellBasell Industries NV's profitability score is Hidden . We take all the information about a company's profitability, such as its margins, capital efficiency, free cash flow generating ability, and more, and consolidate it into one single number: the profitability score. The higher the profitability score, the more profitable the company is.
Profitability Score
We take all the information about a company's profitability, such as its margins, capital efficiency, free cash flow generating ability, and more, and consolidate it into one single number: the profitability score. The higher the profitability score, the more profitable the company is.
We take all the information about a company's profitability, such as its margins, capital efficiency, free cash flow generating ability, and more, and consolidate it into one single number: the profitability score. The higher the profitability score, the more profitable the company is.
Profitability Score
