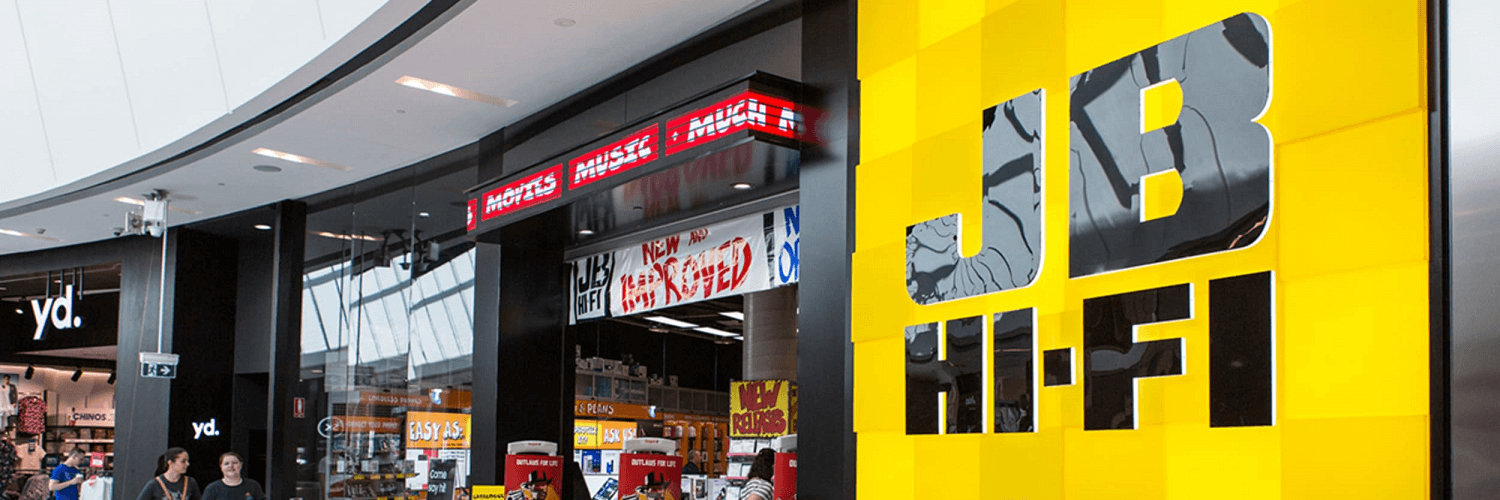

JB Hi-Fi Ltd
F:JB3

Decide at what price you'd be comfortable buying and we'll help you stay ready.
|
J
|
JB Hi-Fi Ltd
F:JB3
|
AU |
|
A
|
Axon Enterprise Inc
XMUN:TCS
|
US |

|
Uber Technologies Inc
BMV:UBER
|
US |
|
F
|
Ferrari NV
F:2FE
|
IT |

|
Konami Group Corp
F:KOA0
|
JP |
|
D
|
D'Ieteren Group NV
SWB:DJDA
|
BE |
|
P
|
Pultegroup Inc
XMUN:PU7
|
US |

|
Indoritel Makmur Internasional Tbk PT
IDX:DNET
|
ID |
|
Z
|
Zijin Mining Group Co Ltd
XMUN:FJZ
|
CN |
|
H
|
Helmerich and Payne Inc
XMUN:HPC
|
US |
|
B
|
Best Buy Co Inc
DUS:BUY
|
US |
|
C
|
Case Group AB
F:V9E
|
SE |
|
I
|
Infineon Technologies AG
SWB:IFX
|
DE |
Dividends
Dividend Yield
JB Hi-Fi Ltd

| Current Yield | |
| Min Yield | |
| Max Yield | |
| Average Yield | |
| Median Yield |
Dividend Per Share
JB Hi-Fi Ltd
JB3 have increased by 135%.
Payout Ratio
JB Hi-Fi Ltd
Peers Comparison
Dividends
Shareholder Yield
Current shareholder yield for JB3 is
hidden
.
Peers Comparison
Shareholder Yield
Buybacks
Buyback Yield measures how much a company reduces its outstanding shares through repurchases, expressed as a percentage.
This metric directly reflects the company’s efforts to return value to shareholders. By reducing the number of shares, buybacks can increase earnings per share and potentially boost the stock's price.

Peers Comparison
Buybacks
Debt Paydown
Debt Paydown Yield measures the amount of debt a company repays within a specific period, shown as a percentage of its market capitalization.
This metric indicates how the company is using its capital to decrease financial liabilities, which can strengthen its financial health and potentially enhance shareholder value.
Peers Comparison
Debt Paydown
Price Appreciation
JB3 Price
JB Hi-Fi Ltd
| Average Annual Return |
N/A
|
| Standard Deviation of Annual Returns |
N/A
|
| Max Drawdown | -22% |
| Market Capitalization | 9.1B EUR |
| Shares Outstanding | 109 334 000 |
| Percentage of Shares Shorted |
N/A
|
