
Invisio AB
F:ICQ

Decide at what price you'd be comfortable buying and we'll help you stay ready.
|
I
|
Invisio AB
F:ICQ
|
SE |

|
Hartadinata Abadi Tbk PT
IDX:HRTA
|
ID |
|
Industrias Penoles SAB de CV
OTC:IPOAF
|
MX |
|
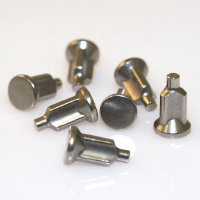
Omni Lite Industries Canada Inc
XTSX:OML
|
US |
|
P
|
Public Storage
F:PUP
|
US |

|
Applovin Corp
NASDAQ:APP
|
US |

|
Alimentation Couche-Tard Inc
OTC:ANCTF
|
CA |
|
E
|
EDP Energias de Portugal SA
F:EDP
|
PT |
|
C
|
CDL Hospitality Trusts
OTC:CDHSF
|
SG |
|
S
|
Shenzhen Kaifa Technology Co Ltd
SZSE:000021
|
CN |

|
Alamtri Resources Indonesia Tbk PT
F:A640
|
ID |
|
A
|
Asia Medical & Agricultural Laboratory & Research Center PCL
SET:AMARC
|
TH |
|
T
|
Truist Financial Corp
DUS:BBK
|
US |
|
I
|
Intesa Sanpaolo SpA
XBER:IES
|
IT |
|
G
|
Gap Inc
XMUN:GAP
|
US |

|
Humana Inc
NYSE:HUM
|
US |
|
F
|
Farmland Partners Inc
F:0FA
|
US |
Dividends
Dividend Yield
Invisio AB

| Current Yield | |
| Min Yield | |
| Max Yield | |
| Average Yield | |
| Median Yield |
Dividend Per Share
Invisio AB
ICQ have increased by 704%.
Payout Ratio
Invisio AB
Peers Comparison
Dividends
Shareholder Yield
Current shareholder yield for ICQ is
hidden
.
Peers Comparison
Shareholder Yield
Buybacks
Buyback Yield measures how much a company reduces its outstanding shares through repurchases, expressed as a percentage.
This metric directly reflects the company’s efforts to return value to shareholders. By reducing the number of shares, buybacks can increase earnings per share and potentially boost the stock's price.

Peers Comparison
Buybacks
Debt Paydown
Debt Paydown Yield measures the amount of debt a company repays within a specific period, shown as a percentage of its market capitalization.
This metric indicates how the company is using its capital to decrease financial liabilities, which can strengthen its financial health and potentially enhance shareholder value.
Peers Comparison
Debt Paydown
Price Appreciation
ICQ Price
Invisio AB
| Average Annual Return | 10.86% |
| Standard Deviation of Annual Returns | 25.76% |
| Max Drawdown | -54% |
| Market Capitalization | 10.2B EUR |
| Shares Outstanding | 45 590 194 |
| Percentage of Shares Shorted |
N/A
|
