Copart Inc
NASDAQ:CPRT

Decide at what price you'd be comfortable buying and we'll help you stay ready.

|
Johnson & Johnson
NYSE:JNJ
|
US |

|
Berkshire Hathaway Inc
NYSE:BRK.A
|
US |

|
Bank of America Corp
NYSE:BAC
|
US |

|
Mastercard Inc
NYSE:MA
|
US |

|
UnitedHealth Group Inc
NYSE:UNH
|
US |

|
Exxon Mobil Corp
NYSE:XOM
|
US |

|
Pfizer Inc
NYSE:PFE
|
US |

|
Nike Inc
NYSE:NKE
|
US |

|
Visa Inc
NYSE:V
|
US |

|
Alibaba Group Holding Ltd
NYSE:BABA
|
CN |

|
JPMorgan Chase & Co
NYSE:JPM
|
US |

|
Coca-Cola Co
NYSE:KO
|
US |

|
Verizon Communications Inc
NYSE:VZ
|
US |

|
Chevron Corp
NYSE:CVX
|
US |

|
Walt Disney Co
NYSE:DIS
|
US |

|
PayPal Holdings Inc
NASDAQ:PYPL
|
US |
 Copart Inc
Cash & Cash Equivalents
Copart Inc
Cash & Cash Equivalents
Copart Inc
Cash & Cash Equivalents Peer Comparison
Competitors Analysis
Latest Figures & CAGR of Competitors
| Company | Cash & Cash Equivalents | CAGR 3Y | CAGR 5Y | CAGR 10Y | ||
|---|---|---|---|---|---|---|
|
|
Copart Inc
NASDAQ:CPRT
|
Cash & Cash Equivalents
$5.1B
|
CAGR 3-Years
45%
|
CAGR 5-Years
53%
|
CAGR 10-Years
43%
|
|
|
KAR Auction Services Inc
NYSE:KAR
|
Cash & Cash Equivalents
$119.3m
|
CAGR 3-Years
-7%
|
CAGR 5-Years
-38%
|
CAGR 10-Years
0%
|
|

|
UniFirst Corp
NYSE:UNF
|
Cash & Cash Equivalents
$151.8m
|
CAGR 3-Years
-15%
|
CAGR 5-Years
-22%
|
CAGR 10-Years
-8%
|
|

|
VSE Corp
NASDAQ:VSEC
|
Cash & Cash Equivalents
$69.4m
|
CAGR 3-Years
418%
|
CAGR 5-Years
180%
|
CAGR 10-Years
58%
|
|

|
Aurora Innovation Inc
NASDAQ:AUR
|
Cash & Cash Equivalents
$221m
|
CAGR 3-Years
-6%
|
CAGR 5-Years
-11%
|
CAGR 10-Years
N/A
|
|

|
Cintas Corp
NASDAQ:CTAS
|
Cash & Cash Equivalents
$183.2m
|
CAGR 3-Years
27%
|
CAGR 5-Years
-20%
|
CAGR 10-Years
-5%
|
|
Copart Inc
Glance View
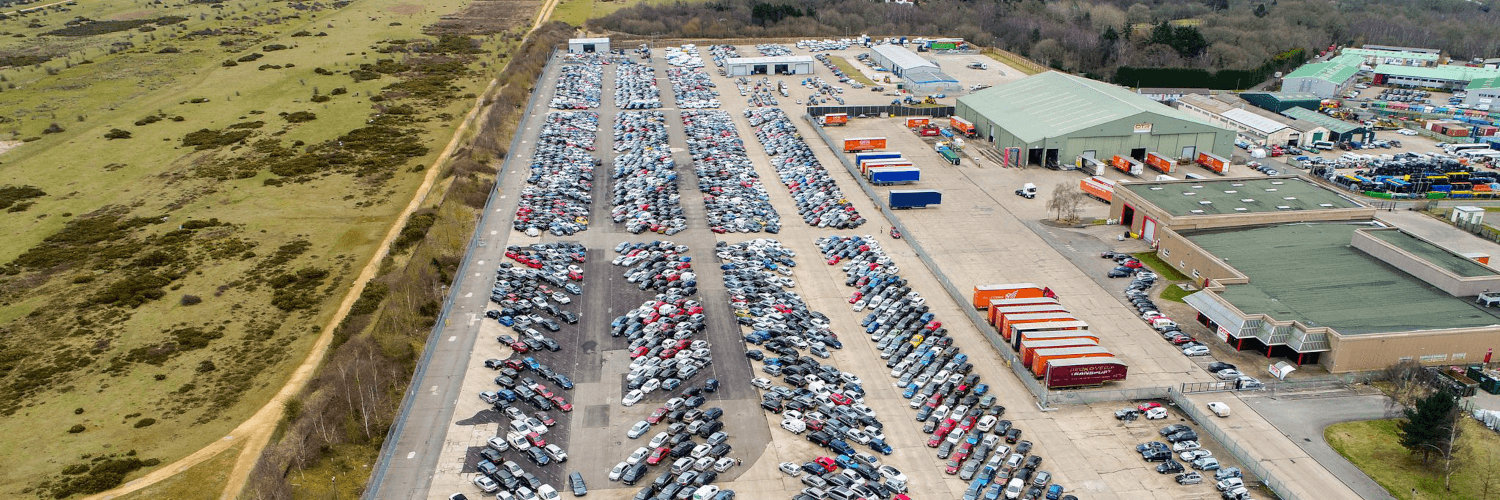
In the world of auto auctions, Copart Inc. stands as a silent yet dynamic player transforming how vehicles find their second lives. Founded in 1982 by Willis Johnson, Copart has steadily evolved, becoming a titan in the field of online vehicle auctions. The company specializes in connecting buyers and sellers of used, wholesale, and salvage cars through its virtual marketplace. Aimed primarily at insurance companies, who find themselves laden with vehicles deemed uneconomical to repair, Copart plays a pivotal role. It facilitates the sale of these vehicles to a diverse pool of buyers, ranging from dismantlers and recyclers to individual enthusiasts and dealers. This robust platform, underlined by a sophisticated inventory technology and an intuitive bidding process, has enabled Copart to channel the intricacies of the salvage car market into a seamless online experience, underscoring its importance in the automotive ecosystem. Copart's monetization strategy is impressively multifaceted and resilient. The company's revenue streams primarily from transaction fees charged to both buyers and sellers—each side paying for the ability to connect with the other on this vast platform. Moreover, Copart enhances its revenue generation through ancillary services such as vehicle transportation, storage, and financing options to its clientele. Its global network of auction locations ensures efficient logistics and helps cultivate a sense of urgency and competition among buyers. By leveraging its scale and technological innovation, Copart has not only streamlined an otherwise cumbersome aspect of the automotive industry but has also positioned itself strategically across the globe, ensuring that its operational efficiencies translate into tangible financial returns. This dual focus on cutting-edge digital infrastructure and strategic expansion allows Copart to maintain its influence and continue thriving in an increasingly competitive marketplace.
See Also
What is Copart Inc's Cash & Cash Equivalents?
Cash & Cash Equivalents
5.1B
USD
Based on the financial report for Jan 31, 2026, Copart Inc's Cash & Cash Equivalents amounts to 5.1B USD.
What is Copart Inc's Cash & Cash Equivalents growth rate?
Cash & Cash Equivalents CAGR 10Y
43%
Over the last year, the Cash & Cash Equivalents growth was 53%. The average annual Cash & Cash Equivalents growth rates for Copart Inc have been 45% over the past three years , 53% over the past five years , and 43% over the past ten years .
